How to efficiently offer support/resources to train students who might start studying SDM approaches but need a lot of guidance to get going?
On this page
By: Courtney Burk, Alana Westwood, and Robert Buchkowski
So, you want to learn how to create and utilize SDMs.? First, what is an SDM? An SDM, or a species distribution model is a now common method in the fields of biogeography, ecology, and conservation to predict species distribution, movement, and/or abundance across a landscape. You’ve probably heard several terms that all fall under the umbrella of species distribution modelling, including habitat models, climate envelopes, ecological niche models (ENMs), resource selection functions (RSFs), bioclimatic models, connectivity models, and range maps. SDMs use algorithms to fit mathematical functions that describe species presence/absence across environmental space and the relationship to each environmental variable and then generate predictive maps of species distribution in geographical space, aka predictive forecasting (Figure 1). In some cases, SDMs are used to explain or understand how environmental conditions influence the occurrence or abundance of a species.
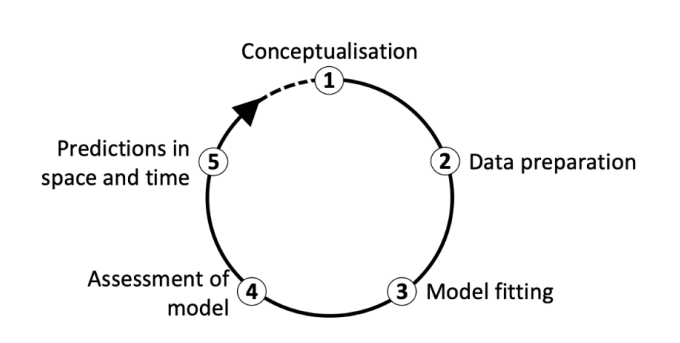
Figure 1: The main modelling cycle in species distribution modelling (Zurell, 2020).
There are two main data components to an SDM: (1) species data and (2) environmental data. Species data can comprise presence-only data (just where that species has been observed), presence-absence data (known presence and absence locations based on surveys), abundance-absence data (which includes counts), or occupancy data (repeated site surveys). Regardless of the data type you need to have coordinates of the locations where the species of interest occurred (or didn’t occur). These can be archived species location data, such as from museum records or citizen science initiatives (e.g., ebird, iNaturalist, FrogWatch, etc.), or a new dataset you collect in the field. Environmental data is both the biotic and abiotic conditions that describe where a species is present or absent. Now, there are dozens of variables to choose from to incorporate into your SDM. The variables you choose largely depend on the scale of your model and the completeness of data available.
But how much data do you need? Where do you get this data? What do I do? Unfortunately, this is not the place to learn all the ins and outs for SDMs.
As you explore SDMs, there are hundreds of resources out there and available to help you meet your needs with learning how to utilize this powerful data tool to your advantage. However, we have put together a shortlist of platforms and base programs to choose from (Table 1). Each of them has their benefits, caveats, and data requirements. Table 1, a non-exhaustive list, describes some commonly used platforms, required data, and links to further tutorials or readings to help you on your way!
Table 1: Modelling methods, type of species data required, and suggested further reading.
| Method | Model Name/Software | Type | Species Data Type | Links for Further Learning |
| Climatic envelope | BIOCLIM | Probability | Presence-only | R tutorial; Booth, 2019 |
| Gower metric | DOMAIN | Probability | Presence-only | Carpenter et al., 1993; R tutorial |
| Ecological niche factor analysis (ENFA) | BIOMAPPER | Suitability | Presence/background | BioMapper tutorial |
| Maximum entropy | MAXENT | Suitability | Presence/background | YouTube tutorial; Maxent step by step |
| Genetic algorithm | GARP | Suitability | Presence/pseudoabsence | Haase et al., 2021; Tutorial |
| Regression: generalized linear model (GLM) and generalized additive model (GAM) | GRASP | Probability | Presence/absence | Tutorial; Guisan et al., 2002 |
| Artificial neural network (ANN) | SPECIES, MATLAB | Probability | Presence/absence | Introduction; YouTube tutorial |
| Classification and regression trees (CART) | BIOMOD | Probability | Presence/absence | Tutorial |
| Multivariate adaptive regression splines (MARS) | MARS (with R) | Probability | Presence/absence | Introduction; Elith and Leathwick, 2007; R tutorial |
| Favourability function (FF) | FF (with R) | Probability | Presence/absence | Introduction; R tutorial |
| Random forest (RF) | RF (with R) | Probability | Presence/background | Valavi et al., 2021 |
| Boosted regression trees (BRT) | BRT (with R) | Probability | Presence/absence | R tutorial; Elith et al., 2008 |
| Bayesian species distribution models | spOccupancy (with R) | Probability | Presence/absence | Single-Species, Multi-Species, and Integrated Spatial Occupancy Models |